
How to Test a Chatbot Welcome Message: A $1,500 Revenue Example
Test two chatbot greetings with clear outcomes and a hypothetical $1,500 revenue example. Check conversion uncertainty, margin, and measurement.
10 Nov 2026•7 min read

Software Engineer

Changing a chatbot welcome message takes a few minutes. Finding out whether the change helped requires a clearer test.
More chat openings can mean more interest. They can also mean more confusion. If the goal is to help visitors buy or complete a useful task, follow the conversation through to that outcome.
This guide shows how to compare two greetings and interpret the result. The $1,500 figure is calculated from hypothetical test data in USD. It demonstrates the arithmetic; it is not a BoundBot customer result or a promised uplift.
Choose the outcome before writing the new greeting
Start with one business question. For an ecommerce product page, it might be: “Does a more specific greeting help more eligible visitors complete an order?”
For a service page, a qualified request or confirmed booking may be the better outcome. Define exactly what counts before the test begins.
Choose one primary metric. Keep chat openings, response quality, handoff frequency, and customer complaints as supporting measures. This prevents a busy chat window from becoming the only sign of success.
The outcome must be observable. If purchases occur in another system, decide how you will connect the experiment assignment to the completed order while respecting your privacy and consent requirements.
Compare one meaningful change
Suppose the current greeting is:
Hi, I’m the AI assistant for [Business]. What can I help you with?
The alternative could be:
Hi, I’m the AI assistant for [Business]. Need help choosing a size or understanding delivery? Tell me which product you are considering.
The second greeting gives a more specific entry point. Keep the offer, product information, assistant behavior, and page design the same so the greeting is the main intended difference.
If you change the greeting, discount, audience, and product stock simultaneously, a revenue difference becomes harder to interpret. Record unavoidable changes, such as an item selling out, so they remain visible during the review.
Give comparable visitors a consistent experience
A suitable website experiment should assign eligible visitors randomly and keep each visitor in the same variant. Decide how to handle repeat visits, existing conversations, staff traffic, and bots before launch.
Use a consistent attribution window for both groups. A purchase made later should be counted according to the rule you defined, rather than whichever reporting view makes the result look strongest.
If you show one greeting on Monday and another on Friday, traffic and buying intent may differ. That can be a useful operational comparison, but it is weaker evidence about the greeting itself than a well-run concurrent experiment.
BoundBot’s greeting configuration is not, by itself, an experiment assignment system. Use an appropriate testing implementation for your website and verify that each assigned visitor sees the intended experience.
Define the experiment before launch
Swipe to view all columns →
| Decision | Record before the test |
|---|---|
| Eligible audience | Which visitors and pages are included |
| Assignment | Randomization unit and persistent variant rule |
| Primary outcome | One defined completion event |
| Other changes | What stays fixed and what may change |
| Observation window | How long outcomes can be attributed |
| Stopping approach | A suitable duration or valid stopping rule |
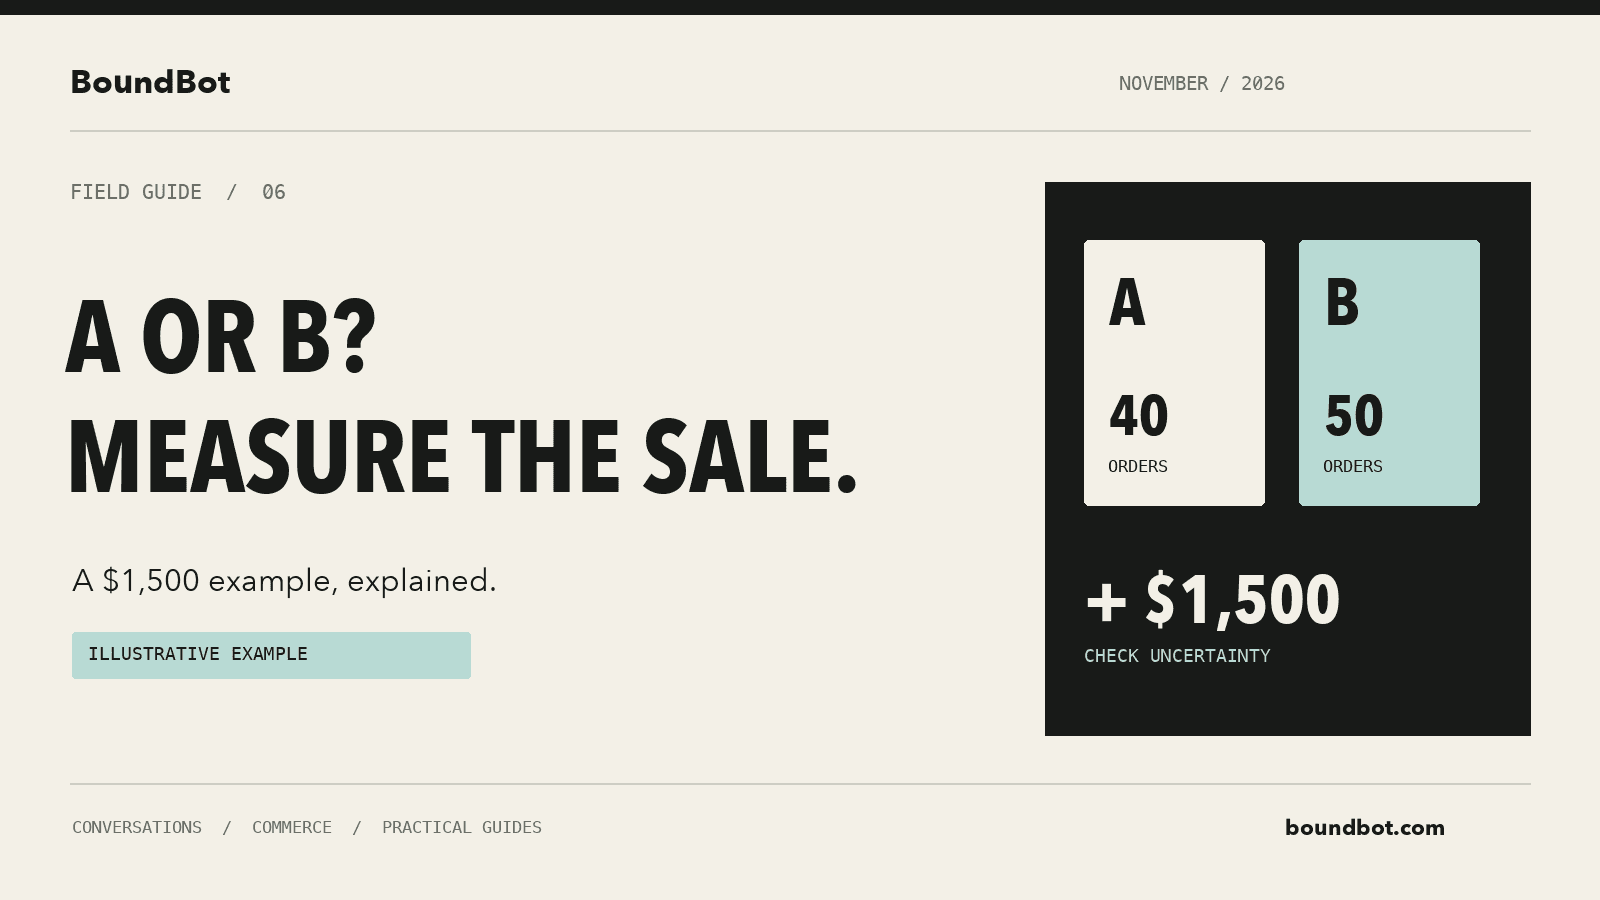
Hypothetical example overview. Illustrative A/B comparison of two chatbot greetings, with a hypothetical USD 1,500 gross revenue difference.
Check the measurement before sending real traffic
Make a test visit through each variant. Confirm that assignment, chat engagement, and the intended completion event can be distinguished correctly.
If you use Google Analytics, its recommended events guidance distinguishes a request for information from a purchase. Those events need the relevant implementation and parameters.
For an ecommerce implementation, follow the official purchase measurement guide. Include the order reference and appropriate revenue information so you can reconcile events with actual orders and handle duplicates.
Check the consent behavior and avoid putting personal customer information into event names or URL parameters. Your sales system should remain the reference for what was actually ordered, canceled, refunded, or collected.
Work through the $1,500 example
Assume each variant receives 1,000 eligible visitors. In the observation window, greeting A is associated with 40 completed orders and greeting B with 50. Assume both groups have an average order value of $150.
Swipe to view all columns →
| Measure | Greeting A | Greeting B |
|---|---|---|
| Eligible visitors | 1,000 | 1,000 |
| Completed orders | 40 | 50 |
| Observed order rate | 4% | 5% |
| Assumed average order value | $150 | $150 |
| Gross order revenue | $6,000 | $7,500 |
The observed difference is ten orders, one percentage point in order rate, and $1,500 in gross revenue for these equally sized groups.
(50 − 40) × $150 = $1,500.
A move from 4% to 5% is a one percentage point increase and a 25% relative increase. Keep those descriptions distinct. Neither description establishes that the true long-run effect is the same as this observed difference.
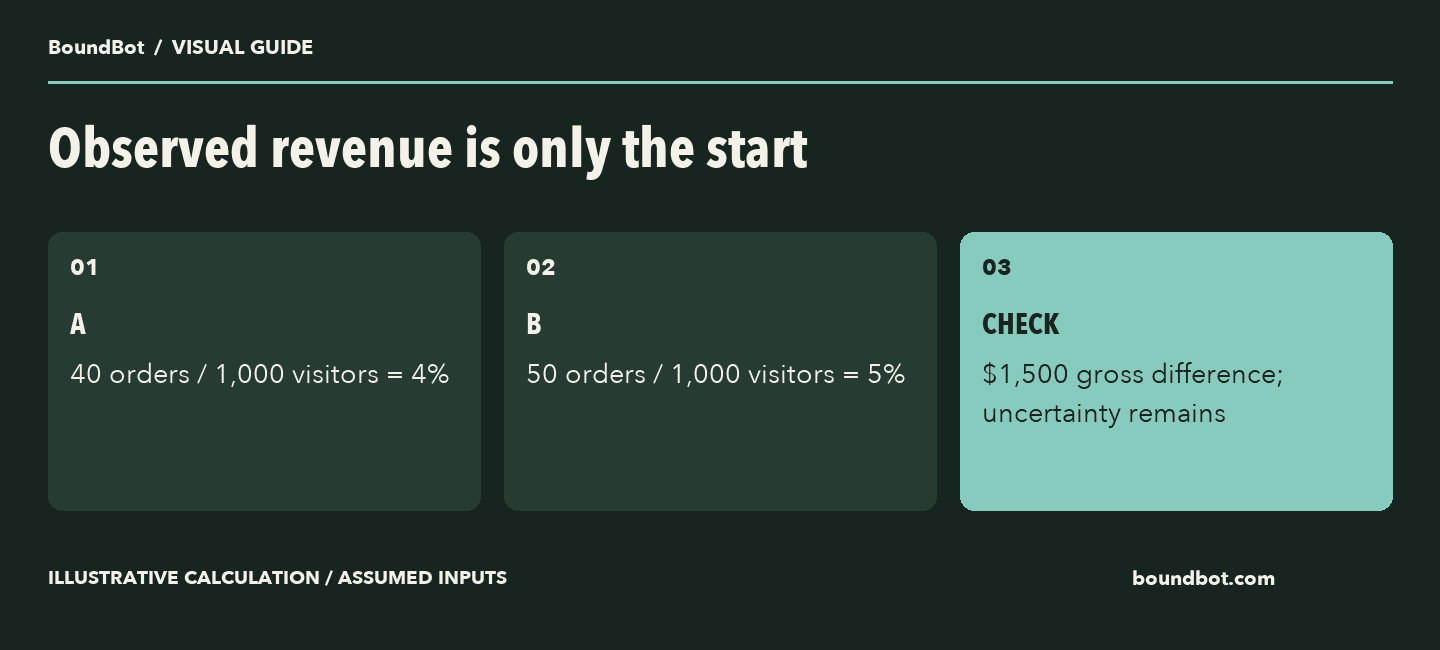
Hypothetical A/B data. The conversion-rate interval includes zero; this is not a proven uplift.
Check uncertainty before calling a winner
The example shows more orders in B. It does not provide enough information on its own to declare that the greeting caused a reliable improvement.
With these assumed counts, a simple normal-approximation interval for the difference in order rates is roughly −0.8 to +2.8 percentage points at 95% confidence. The interval includes zero. This calculation illustrates how an appealing revenue difference can still have substantial statistical uncertainty.
Use a method appropriate to your experiment, including your assignment unit and stopping rule. NIST’s guide to comparing proportions describes the normal-approximation approach and an exact-test alternative. Revenue can also vary because order sizes vary, so a conversion-rate calculation is not a complete revenue analysis.
Decide the minimum improvement worth detecting and the test duration or valid stopping approach in advance. Repeatedly checking until a favorable result appears can produce misleading conclusions.
Convert the sales difference into a business decision
Even if a later, adequately designed test supports an improvement, gross revenue is only part of the decision.
At an assumed 35% contribution margin, the example’s $1,500 gross revenue difference would represent $525 before additional costs not included in that margin. Extra software, implementation, support work, refunds, or discounts can change what remains.
Also inspect the customer experience. If B creates more orders but sends incorrect delivery information, you have an operational problem that the order count alone does not show.
Your decision should combine credible measurement, the economic value of the effect, and acceptable conversation quality. A small team can begin with a simple experiment, provided the definitions are clear and the conclusion matches the evidence.
What the hypothetical result shows
Swipe to view all columns →
| Measure | Example | Interpretation |
|---|---|---|
| Order-rate difference | 5% − 4% = 1 percentage point | Observed difference between equal-sized groups |
| Gross revenue difference | 10 × $150 = $1,500 | Before costs and uncertainty |
| Assumed contribution | $1,500 × 35% = $525 | Before additional excluded costs |
| Approximate 95% interval | −0.8 to +2.8 percentage points | Includes zero; reliable uplift is not established |
Put the learning back into the greeting
Review where visitors started and what they asked next. A useful greeting often reveals information the page should have made easier to find.
If people repeatedly choose delivery help, improve the delivery explanation on the page. If a starter leads into questions the assistant cannot answer, fix the knowledge or narrow the starter’s wording.
In BoundBot, the current app separates the bot’s welcome-message field from WebChat conversation starters. Use the bot configuration guide and widget settings to make the intended change, then verify it on the deployed page.
For wording to test, use our website chatbot welcome-message examples. Change one part that addresses a real customer need, and measure the outcome you chose before launch.
Frequently asked questions
Is 1,000 visitors per variant enough?
It depends on the baseline rate, the smallest effect that matters, and the method used. The illustrative counts here do not support treating the observed difference as a certain improvement.
Should I optimize for more chats?
Use chat engagement as a supporting metric when your goal is sales or task completion. More conversations can be useful, but inspect whether they help visitors reach the intended outcome.
Does BoundBot automatically run this experiment?
The greeting setting supplies content. Experiment assignment and measurement require a suitable implementation that you verify separately.
Can I multiply the example across a whole year?
That would add assumptions about traffic, demand, seasonality, costs, and persistence of the effect. Keep the observed period separate from any forecast and label forecast inputs explicitly.
LAUNCH THE AGENT. KEEP THE HUMAN CONTROL.
START FREE, CONNECT A CHANNEL, AND SHIP YOUR FIRST BOUNDBOT IN MINUTES.